Kubernetes 101: Horizontal Pod Autoscaler
The Horizontal Pod Autoscaler, commonly referred to as HPA, is a Kubernetes component that automatically scales the number of pods in a deployment, replication controller, replica set, or stateful set based on observed CPU utilization.

Introduction
Scalability is the lifeblood of modern applications, allowing them to adapt to varying workload demands seamlessly. Kubernetes, the frontrunner in container orchestration platforms, offers powerful scalability features, one of which is the Horizontal Pod Autoscaler (HPA). This guide offers an in-depth look into the workings of the HPA, its role within Kubernetes, and how it interacts with pods.
What is the Horizontal Pod Autoscaler (HPA)?
The Horizontal Pod Autoscaler, commonly referred to as HPA, is a Kubernetes component that automatically scales the number of pods in a deployment, replication controller, replica set, or stateful set based on observed CPU utilization. HPA embodies the principle of dynamic scalability, making Kubernetes applications adaptable to workload changes.
The concept of HPA was introduced in Kubernetes v1.2, and it has evolved significantly over the years, with the community adding support for custom and external metrics, which broadened its application scenarios.
HPA's primary role is maintaining application performance during traffic peaks and troughs. When demand spikes, HPA increases the number of pods to ensure that all requests are handled promptly, avoiding a degradation in service quality. Conversely, during periods of low demand, HPA reduces the pod count to conserve resources.

One example of an HPA use case is an e-commerce platform experiencing increased traffic during a sales event. Without HPA, such a scenario could overload the platform, leading to slow responses or even downtime. HPA allows Kubernetes to intelligently adjust resources to maintain optimal service.
How Does the Horizontal Pod Autoscaler Work?

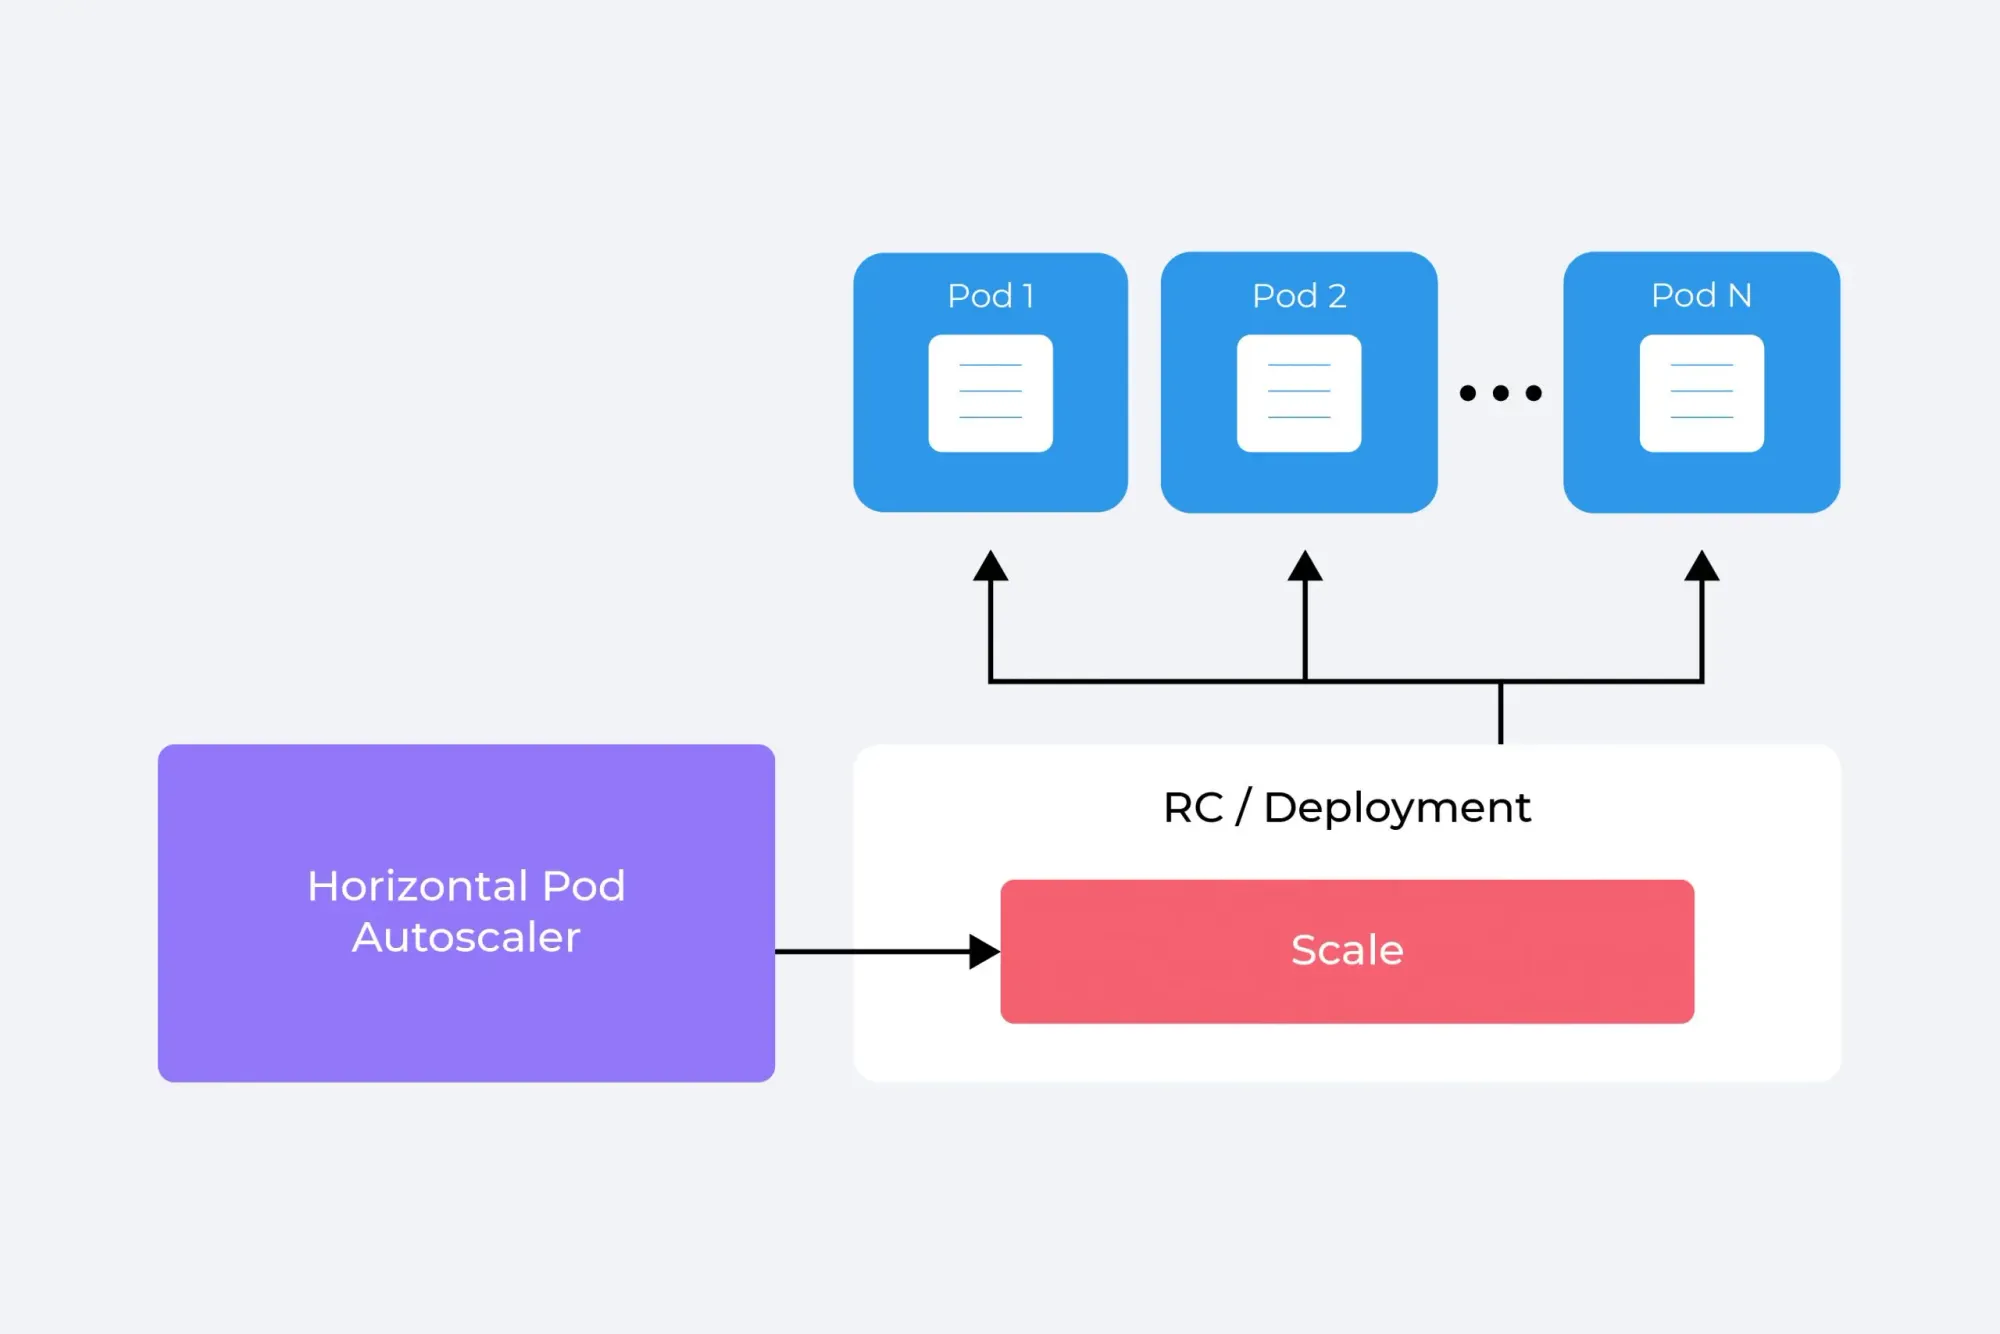
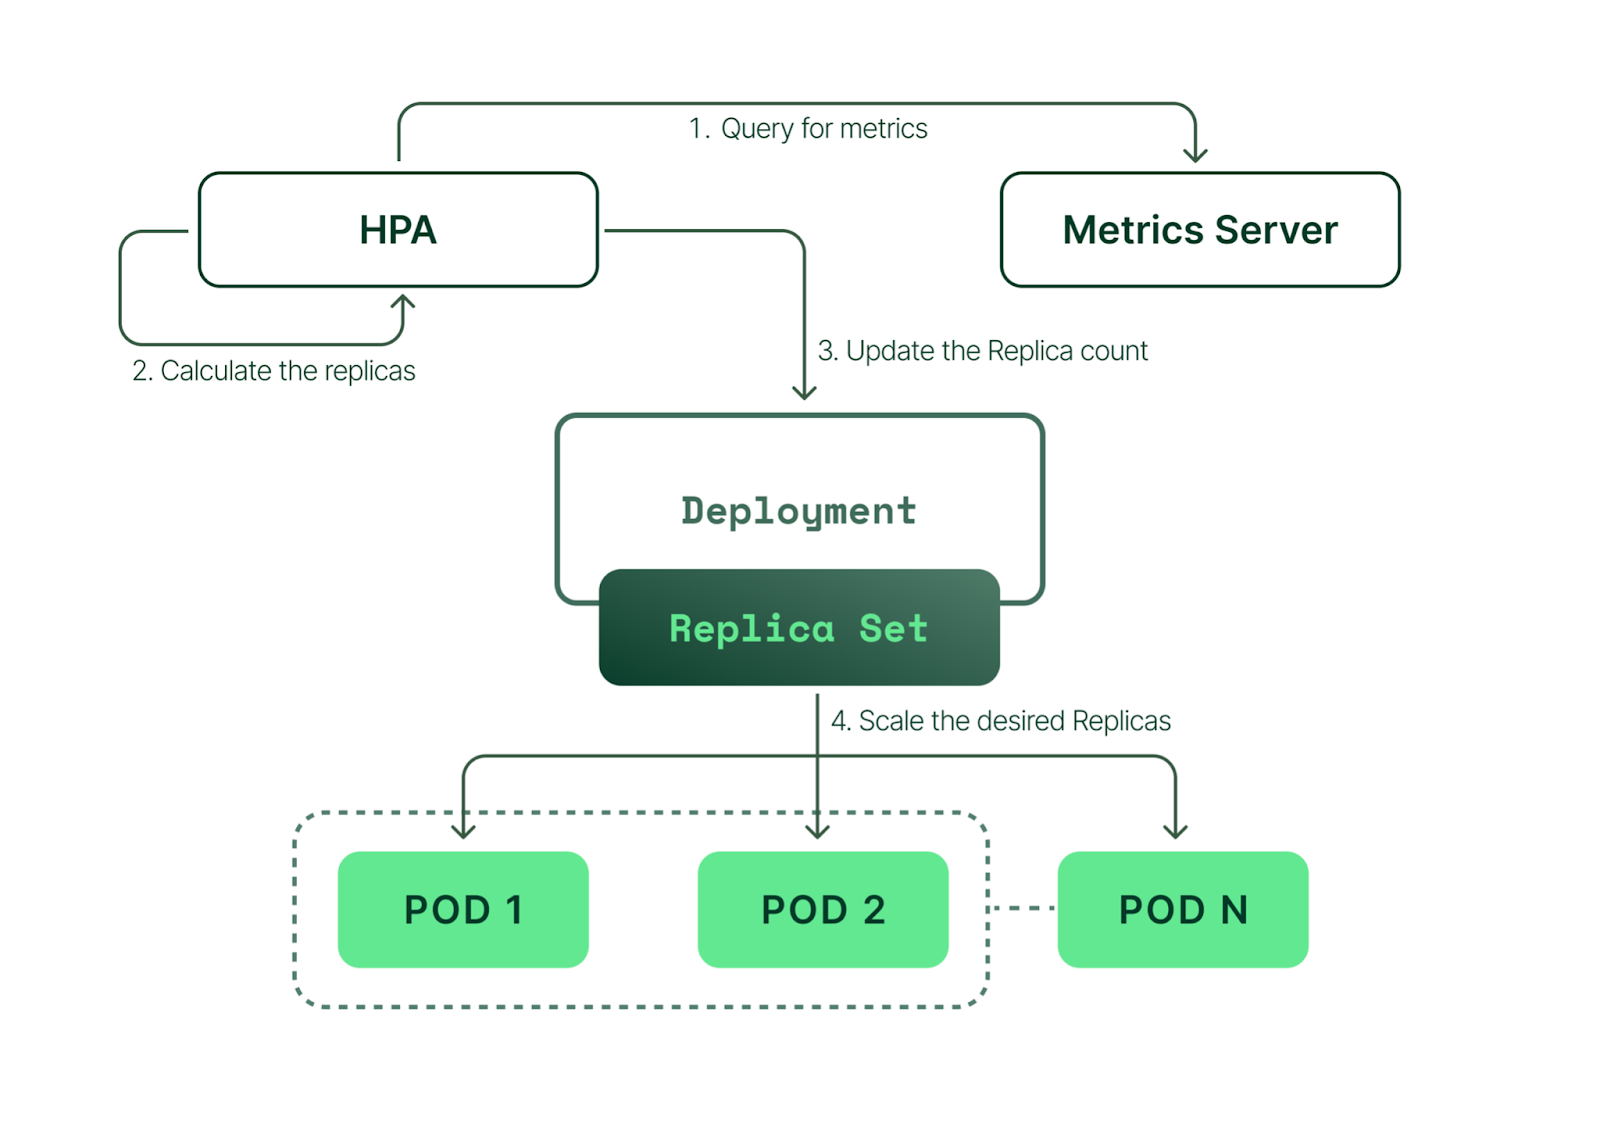
HPA utilizes the underlying ReplicaSets created and managed by Deployments. It scales the number of replicas (pods) within the ReplicaSet based on the defined metrics, ensuring the desired state defined in the Deployment is achieved. This relationship enables HPA to seamlessly scale applications based on workload demands while maintaining the desired deployment configuration.
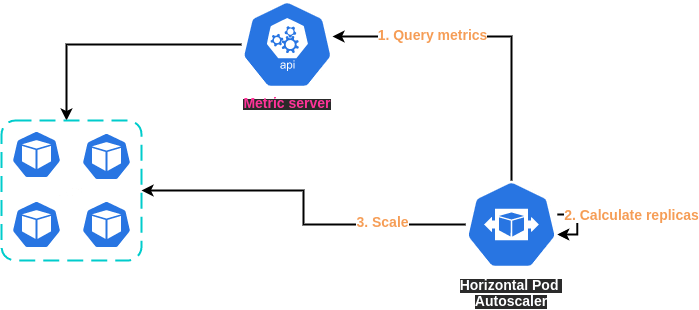
HPA operates based on the concept of target metrics, which could be the CPU utilization of a pod, memory consumption, or any custom or external metrics that Kubernetes can access. HPA continually compares these metrics against predefined thresholds and scales the pods up or down to meet those thresholds.
Let's consider an example with CPU utilization. If you set a target of 50% CPU utilization for your pods and the actual utilization goes over 70%, HPA will increase the number of pods to bring the utilization back to around 50%.
Scaling isn't an instantaneous process due to the cool down or delay periods. These periods prevent frequent scaling, allowing the system to stabilize before initiating another scaling event. This concept is essential in scenarios where workloads are unpredictable and change rapidly.
Setting Up Horizontal Pod Autoscaler
Here is an example of a Horizontal Pod Autoscaler (HPA) manifest file in YAML format, and its explanation:
This HPA manifest file can be broken down into several key sections:
apiVersion: This specifies the API version that this manifest uses. In this case, it'sautoscaling/v2beta2, the version that introduced support for multiple metrics.kind: This specifies the kind of Kubernetes object that you want to create. Here, it'sHorizontalPodAutoscaler.metadata: This includes metadata about the HPA object. Thenamefield specifies the name of the HPA object, andnamespacespecifies the namespace in which the object is created.spec: This is where the specifications for the HPA are defined.
scaleTargetRef: This is a reference to the scaling target; the deployment that HPA will scale.apiVersionandkindspecify the API version and kind of the target object, whilenamespecifies its name.
minReplicasandmaxReplicas: These specify the minimum and maximum number of pods that HPA should maintain. In this case, the number of pods will never go below 3 or above 10.
metrics: This is a list of metrics that HPA will monitor. Here, it's monitoring CPU utilization.
type: This specifies the type of metric. Here, it'sResource, indicating a resource metric.
resource: This defines the resource to monitor.namespecifies the name of the resource, andtargetdefines the target value.
type: This specifies how the target value is expressed. Here, it'sUtilization, indicating that the target is a percentage of the resource's capacity.
averageUtilization: This is the target average utilization of the resource as a percentage. Here, HPA will aim to keep CPU utilization at 50%.
When you apply this HPA manifest file to your Kubernetes cluster, it will create an HPA object that monitors the CPU utilization of the pods in the hpa-demo-deployment deployment, and adjusts the number of pods to maintain an average CPU utilization of 50%, with a minimum of 3 pods and a maximum of 10 pods.
HPA Metrics
Metrics in Kubernetes Horizontal Pod Autoscaler (HPA) are the quantitative measures HPA uses to make scaling decisions. They tell HPA how your application is performing and whether it needs to scale up (increase the number of pods) or scale down (reduce the number of pods).
There are four types of metrics that HPA can use:
- CPU Utilization: This is a resource metric, and it measures how much CPU your pods are using as a percentage of their requested CPU. If you set a target CPU utilization, HPA will add or remove pods to try and achieve that target. For instance, if the target is 50%, and current CPU utilization is 70%, HPA will create more pods to bring down the average CPU utilization closer to 50%.
- Memory Utilization: This is also a resource metric, it works the same way as CPU utilization, but with memory usage instead of CPU.
- Custom Metrics: These are application-specific metrics that you define. They could be anything from the number of active users to the number of jobs in a queue. These metrics are usually defined and collected using a monitoring system like Prometheus and then made accessible to the HPA.
- External Metrics: These are similar to custom metrics, but they originate outside the Kubernetes cluster. They could be metrics from cloud provider services or other APIs.
The calculation of these metrics can vary depending on their type. Resource metrics like CPU and memory utilization are calculated as a percentage of the resource requests set for the pods. For instance, if a pod requests 200m CPU (0.2 CPU), and is using 100m CPU (0.1 CPU), its CPU utilization is 50%.
Custom and external metrics are a bit different. These metrics are represented as either a raw value or as a utilization. Raw values are used as-is, and a target value is specified in the HPA. If the metric exceeds the target, HPA scales up, and if it falls below the target, HPA scales down. Utilization metrics work similarly to resource metrics: they represent usage as a proportion of the capacity, and HPA scales to maintain that proportion.
Here's an example of an HPA configured with a custom metric (the number of open connections):
In this example, HPA will monitor the open-connections metric, which represents the number of open connections per pod. If the average number of open connections per pod exceeds 100, HPA will scale up. If it falls below 100, HPA will scale down, always maintaining a minimum of 2 pods and a maximum of 10 pods.
About 8grams
We are a small DevOps Consulting Firm that has a mission to empower businesses with modern DevOps practices and technologies, enabling them to achieve digital transformation, improve efficiency, and drive growth.
Ready to transform your IT Operations and Software Development processes? Let's join forces and create innovative solutions that drive your business forward.
Subscribe to our newsletter for cutting-edge DevOps practices, tips, and insights delivered straight to your inbox!
